Introduction to Barchart.com
In today’s fast-moving financial world, access to accurate market information is essential for investors and traders. Barchart.com is an online financial platform that provides market data, stock charts, financial news, and analytical tools to help users understand market movements. Whether you are a beginner learning about stocks or an experienced trader researching investment opportunities, Barchart offers a range of resources for financial market analysis.
The platform covers multiple markets, including stocks, exchange-traded funds (ETFs), futures, options, currencies, and commodities. Users can explore price movements, review historical performance, compare securities, and follow market trends from one place.
Barchart.com is designed to make financial information more accessible, helping users organize their research and make more informed decisions.
What Is Barchart.com?
Barchart.com is a financial information website operated by Barchart, a market data and technology company founded in 1995. It serves individual investors, professional traders, businesses, and other financial market participants.
The platform combines market information with tools that help users evaluate securities and monitor financial developments. Depending on the market and service, users can access real-time, delayed, and historical data.
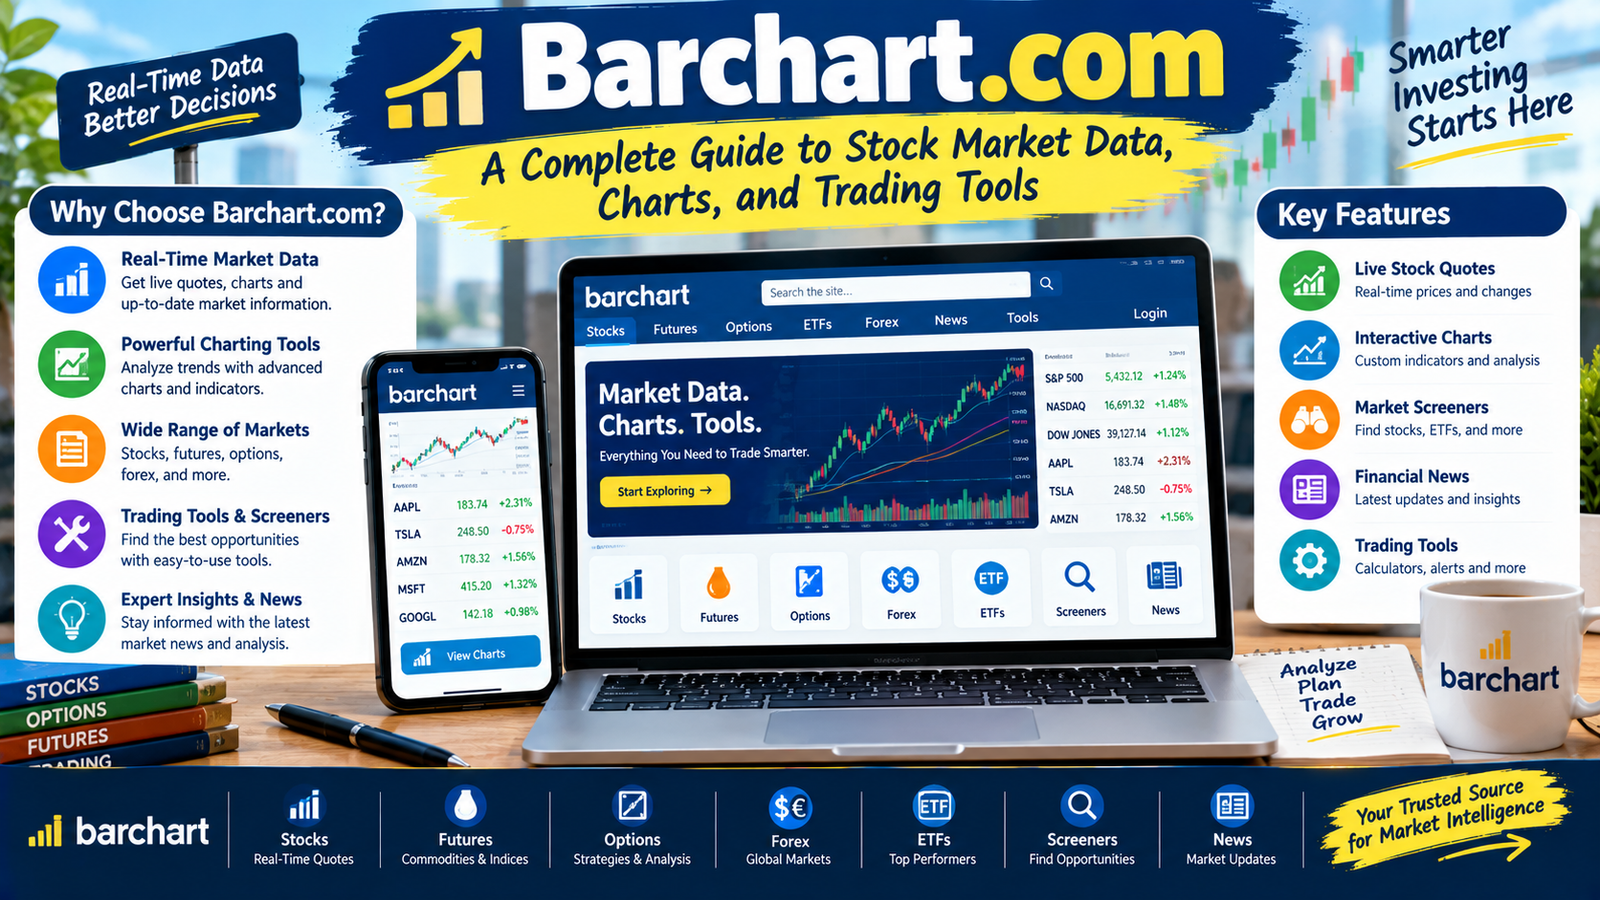
Key features of Barchart.com include:
- Stock prices and market summaries
- Interactive financial charts
- Futures and commodity market information
- Options data and analysis tools
- Financial news and company information
- Stock screeners and performance rankings
- Watchlists and portfolio tracking
- Technical indicators and trading signals
These resources make Barchart a useful starting point for researching different financial instruments.
Main Features of Barchart.com
One of the biggest advantages of Barchart.com is its broad selection of financial tools. Instead of relying on several separate websites, users can explore different types of market information through a single platform.
1. Stock Market Data
Barchart provides information about publicly traded companies, including stock prices, price changes, trading volume, and historical performance. Users can also explore market indexes and identify stocks that are gaining or losing value.
This information can help investors compare companies, monitor their existing investments, and identify securities for further research.
2. Interactive Charts
Charts are important for understanding how financial assets move over time. Barchart offers interactive charting tools that allow users to examine price movements across different periods.
Depending on the chart and instrument, users can explore candlestick, line, bar, and area charts. Technical studies and drawing tools can also help traders investigate potential trends and important price levels.
3. Financial News and Market Updates
Financial news can influence stock prices, commodity markets, and investor sentiment. Barchart provides market-related news and commentary to help users follow important developments.
Reading news alongside price charts can provide additional context when researching a company or financial instrument.
4. Futures and Commodities
Barchart also covers futures contracts and commodity markets, including agricultural products, energy, and metals.
This information may be useful for commodity traders, agricultural businesses, and investors who want to understand how supply, demand, weather, and economic developments affect market prices.
How to Use Barchart.com
Getting started with Barchart.com is relatively straightforward. Users can begin exploring publicly available market information and then use additional tools as their research needs grow.
Follow these steps:
- Visit the website: Open https://www.barchart.com in your browser.
- Choose a market: Select stocks, options, futures, currencies, or another available market category.
- Search for an asset: Enter a company name, ticker symbol, or financial instrument.
- Review market information: Examine price changes, historical data, trading volume, and relevant news.
- Analyze charts: Select a suitable timeframe and explore available technical indicators.
- Create a watchlist: Track selected securities in one place when the relevant feature is available.
- Continue your research: Compare assets and review relevant company fundamentals before making an investment decision.
Taking a systematic approach can make market research easier and help users avoid making decisions based on a single price movement.
Benefits of Using Barchart.com
Barchart.com offers several advantages for people who regularly follow financial markets.
- Broad market coverage: Users can research several asset classes through one platform.
- Convenient charting tools: Interactive charts help users review historical price movements.
- Market news: Financial updates provide context for changing prices and investor sentiment.
- Technical analysis: Indicators and chart studies can help users investigate possible trends.
- Market screening: Ranking lists and screening tools help narrow down securities for further research.
- Portfolio monitoring: Watchlists and portfolio features help users organize the assets they follow.
- Flexible research: Users can explore short-term price movements as well as longer-term historical performance.
These benefits make Barchart useful for both everyday market monitoring and more detailed financial research.
Barchart.com for Beginners
Beginners may find financial websites confusing because of the many numbers, charts, and technical terms. Barchart.com can help new investors become familiar with market data and develop a more structured research process.
Start by learning basic concepts such as stock prices, market capitalization, trading volume, dividends, and price-to-earnings ratios. Next, explore charts to understand how prices change over time.
It is also important to distinguish between technical analysis and fundamental analysis. Technical analysis studies price movements and market patterns, while fundamental analysis examines a company’s financial condition, business performance, and growth prospects.
Beginners should avoid relying entirely on automated ratings or trading signals. These tools can support research, but they cannot guarantee profitable results.
Understanding Barchart Charts and Indicators
Technical indicators are mathematical calculations based on price, volume, or other market data. Barchart offers charting features that allow users to examine several commonly used indicators.
Examples include:
- Moving averages: Help summarize price movements over a selected period.
- Relative Strength Index (RSI): Measures the speed and magnitude of recent price changes.
- Moving Average Convergence Divergence (MACD): Helps examine momentum and potential changes in trends.
- Bollinger Bands: Show price levels relative to a moving average and measures of volatility.
- Support and resistance: Refer to price areas where buying or selling activity may become significant.
No indicator is accurate in every market condition. Traders often combine several analytical methods and consider broader economic conditions before reaching a conclusion.
Is Barchart.com Free to Use?
Barchart.com offers publicly accessible market information and certain free tools. However, some advanced research features, data services, and membership benefits may require a paid subscription.
The availability of real-time quotes can also vary by exchange, instrument, and service. Some prices may be delayed, so users should check the data labels and membership details before relying on a quote for a time-sensitive trade.
Before subscribing, compare the available plans and confirm that the features meet your needs. Casual investors may require only basic market information, while active traders might benefit from more advanced screening and analytical tools.
Important Things to Know Before Using Barchart.com
Although Barchart provides useful financial information, users should understand its limitations.
First, market prices can change quickly, and not all displayed quotes are necessarily real-time. Second, technical indicators and trading signals are analytical tools rather than guarantees of future performance. Third, financial news may not capture every factor influencing a particular asset.
For more balanced research, consider reviewing company financial statements, official regulatory filings, economic reports, and other reliable sources. Always account for your financial goals, risk tolerance, and investment timeframe.
Barchart.com should be treated as a research resource rather than a substitute for independent judgment or personalized financial advice.
Conclusion
Barchart.com is a versatile financial platform that brings together market data, interactive charts, financial news, screening tools, and resources for analyzing stocks, futures, options, currencies, and commodities. Its broad market coverage makes it useful for beginners who want to learn about financial markets and experienced traders who need organized research tools.
By learning how to read charts, compare assets, understand technical indicators, and verify market data, users can make better-informed financial decisions. However, no platform can eliminate investment risk or predict future prices with certainty.
For anyone interested in following financial markets and improving their research process, Barchart.com is a practical resource worth exploring.